Machine Learning for Predictive Maintenance : From Physics to Data.
Assume you want to maintain constant pressure in a certain container. You have control of a valve that can pump more air into it, or…
Assume you want to maintain constant pressure in a certain container. You have control of a valve that can pump more air into it, or release some air. It sounds like a simple task: if the pressure is below the target pump some more air in, and if it’s above the target, release some — that should do it. Months pass, and your valve accumulates wear and tear: but you notice nothing, because your controller is doing its job, keeping the pressure constant — even if that means pumping a little more air each week to offset a small leak in the connection between the valve and the container. But the damage accumulates, and one day, something goes ‘crack’ inside the valve, imperceptibly. No warning. The container loses pressure, the failure cascades downstream with critical systems failing, one after the other. Red alerts sound, the floor manager orders ‘all systems down’ until the fault is diagnosed. The culprit is identified: it was the valve. Thankfully you have some extra ones stocked for emergencies. The engineers replace it as quickly as they can — they work overtime, the clock is ticking. One day later, you are back up.
The new valve cost you less than 100 dollars, but the downtime set you back a million. Wouldn’t it be nice to have had some advance warning?
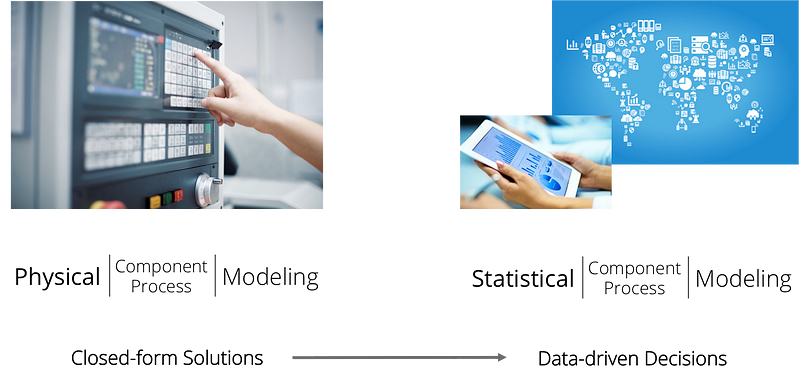
This is the promise of Predictive Maintenance: early warnings for critical failures to avoid downtime. Despite what the media hype might like you to think, the problem is exceptionally hard. Our toy example of air in, air out, oversimplifies real-world industrial control systems, which typically feature a large number of variables that all inter-depend in complex, non-linear fashions. Engineers and physicists will list all these variables and their physical properties, and a few hundreds of pages of mathematics later, they come up with a set of equations that prescribe what actions need to be taken at any given second (indeed, millisecond) to ensure the target variables take the values that they need to take at all times, so as to maintain constant pressure in a container, move a robotic arm in a certain way, etc. But wear and tear is unpredictable: by definition, it pushes the system into a state other than the one originally assumed by the mathematicians and the physicists. Indeed, ‘worn’ states are orders of magnitude harder to describe via physical modelling. Ask any physicist and they will confirm: describing the laws of motion of a bicycle is child’s play in comparison to describing the laws of motion of a bicycle with a nail stuck on its front tyre. In brief, the “physicist-driven” approach does not scale. Can we do better?
Data
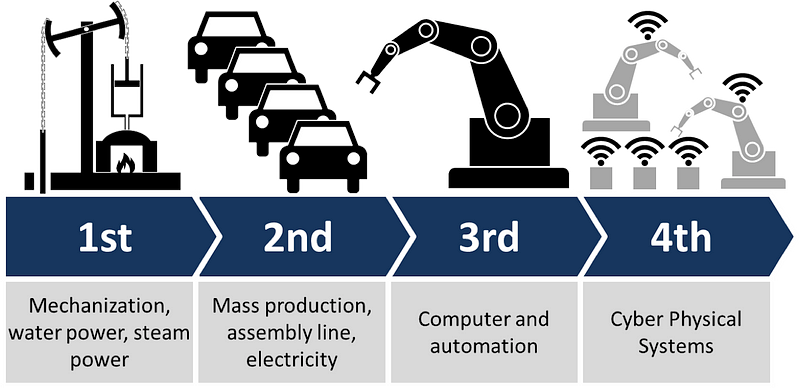
Well, in the words of Lord Kelvin, “if you can’t measure it, you can’t improve it”. And this is precisely why Industry 4.0 is so important: it marks the switch from legacy technologies that involved largely hard-wired industrial systems with minimal data acquisition and data sharing abilities, to next-generation technologies featuring millisecond granularity remote sensing, with gigabit ethernet connections all the way from the IoT device to the cloud. And this is the foundation of the Industry 4.0 promise.
This paradigm shift opens the door to altogether new approaches. It is known from other areas such as machine translation, that with sufficient data, machine learning is able to compete with or even outperform tedious substantive case-by-case theory.
In the same way that machine learning coupled with huge multilingual online corpora managed to outperform decades of linguistic analysis and translation theory, we can expect that machine learning coupled with terabytes of continuous data streams from IoT devices will rapidly compete with physical modelling of each device.
The Stack
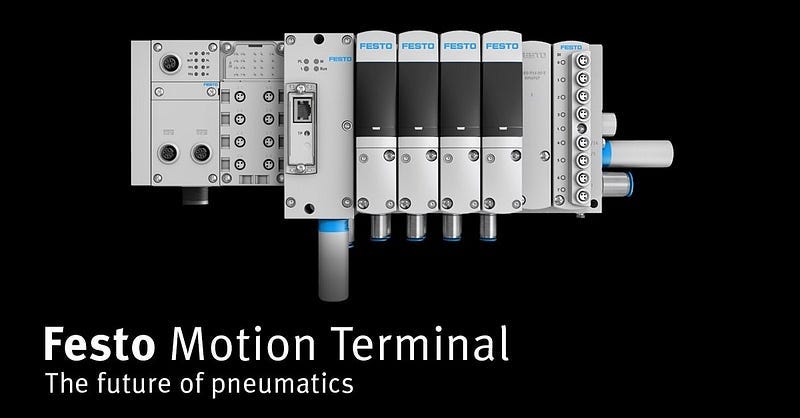
Indeed, that was our expectation when we entered the TechFounders program with the proposal to deploy our proprietary algorithms for anomaly detection on data streams against data from one of the largest German supplier of pneumatic and electrical automation components, Festo. Festo is launching at Hannover Messe its Festo Motion Terminal, an intelligent pneumatic automation platform replacing the functions of around 50 different individual components, a technical tour de force in “software defined hardware”. In 2016 Mentat used the new intelligent valve to develop and test AI-methods for condition monitoring.
Our engine has four components:
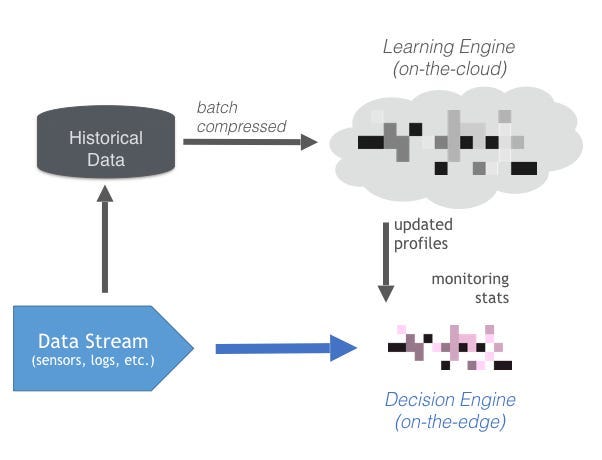
A data collector deployed on the device (in our case, a Raspberry Pi connected via an ethernet cable to the actual component) would take care of the ETL process of transforming raw data generated from the device’s sensors into messages that we can consume downstream. This component is our data ingestion engine.
An anomaly detector sitting on-the-edge (in our case, on-the-Pi), would convert the raw data signals into what we refer to as a “feature vector”: this is simply a list of metrics that describe various properties of the raw signal. Just like the signal varies over time, so will its properties, so features must be computed anew every few seconds, using either a sliding window implementation or some form of exponential decay. This component is called the feature extraction engine.
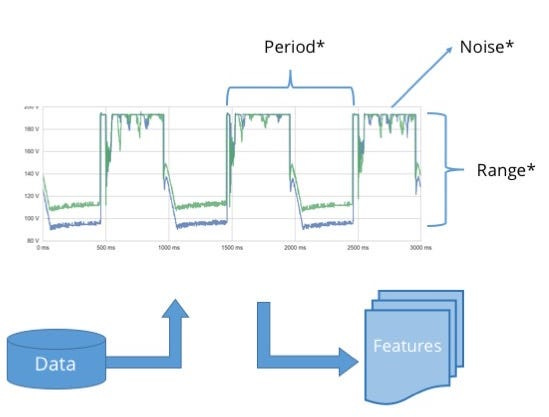
The features then are scored according to a probabilistic profile of what normal behaviour should look like. At the first instance of “abnormal’ behaviour we raise a flag. We refer to this edge component as the decision engine, and it also forms part of our on-the-edge stack.
The data (appropriate compressed and summarised) are also uploaded in regular batches to a cloud instance of our learning engine. This engine is responsible for profiling each device, and maintaining these profiles as more data accumulate. With every new data batch, the engine refreshes the device profiles, and if any of them changes significantly, it is deployed in the form of a “profile patch” to the IoT device.
The end product was designed to closely match Industry 4.0 specs:
Alerts in real-time, without dependency on always-on cloud connections (if that sounds too stringent, consider a gas pipeline in the desert)
High-Bandwidth, Low-CPU edge components: the raspberry Pi was connected via ethernet cable, but is nowhere near as powerful as our Amazon Cloud servers. Thankfully, it doesn’t need to be: once the device has been profiled, comparing its latest measurements against the profile is very cheap computationally (a little like going through a decision tree).
Low-Bandwidth, High-CPU cloud components: we strived to compress the raw data signals as much as possible before we upload. This is critical because as the IoT proliferates, data production will once again exceed our abilities to store data, or in any case process it from cold storage. Indicatively, for a single device with 8 sensors per component and 8 components, each producing one measurement per millisecond, we obtained 250KB of data each second. This amounts to 21GB per day — and that’s just for one device. We expect to support thousands. We used two main techniques to achieve meaningful compression: feature extraction itself compresses by orders of magnitude, and can be followed by active learning techniques, whereby only parts of the raw signal that fail to conform with our device profile are communicated upstream, on the grounds that they are more to likely convey new information.
Context, context, context
Anomaly detection solutions are often plagued by the “cry wolf” problem: they tend to raise too many alerts, so that eventually people stop paying attention to them, which renders them useless. The sophistication of the algorithms and the robustness of the implementation are critical in overcoming this problem, but a factor which is often disregarded is context: the human expert might be aware of information that the algorithm is not. In our use case, the “context” of the operation of a device comprises the environmental conditions in which it operates, as well as the operational mode it is in: what sort of task has it been assigned to perform? Needless to say that a machine learning algorithm tasked with profiling a robotic arm that has never before moved upwards will raise a big red flag the first time it sees the arm move upwards, much to the confusion of the human operator, who is of course aware that such a move is both possible and normal.
We overcome this problem by allowing our profiles to be context-specific: along with the signal features, the learning and decision engines additionally receive data about the state and configuration the device is in, and condition the behavioural profile on this information.
Labels
Our toolbox is designed to operate without the need for any labels: it is not a requirement that an expert should manually tag certain data segments as corresponding to “abnormal” behaviour, and tag everything else as “normal”. Ours is referred to as an unsupervised approach, in contrast to supervised approaches where the algorithm learns to discriminate between examples labelled as “normal” versus examples labelled as “abnormal”.
The benefit of an unsupervised approach is that it does not rely on expensive manual labelling, and is not overly focused on past examples of abnormal behaviour. This gives it better generalisation ability. By the same token, however, unsupervised techniques will exhibit some loss of accuracy in comparison to supervised techniques when it comes to examples of device faults that have been previously seen in the historical dataset.
In the case of predictive maintenance, it is possible to consider a number of common faults and try and reproduce them in a lab, so as to produce a labelled dataset. This is still an expensive process, but one that happens anyway by way of testing components for wear and tear. So in some sense, a certain amount of labelled data is available anyway.
This gave us the chance to switch to what is known as semi-supervised mode, where our profile is instantiated via a classifier that seeks to classify each signal as coming from a healthy device, a device experiencing a failure of a known type (i.e., one that has been seen before in the labelled dataset), and a device experiencing a failure of an unknown type (unsupervised). This covered all the requirements of our industrial partners, so the pilot was on.
Results
When we received the first data batch, I was actually under the weather. My team pinged me on Slack, and I crawled out of bed to my computer to check our first set of results. I actually had to get out of bed because “results” at Mentat is never a single number... Our company has inherited from its founders a masochistic discipline in using best practices when it comes to assessing performance. Our CEO, developed this habit while devising statistically-driven trading strategies, where overestimating predictive accuracy during backtesting could cost you dearly. I, on the other hand, spent much of my time in academia researching this very topic. In any case, our results summaries always need a big screen to review.
But in this case, it didn’t. At a glimpse, we knew this was a huge success. A total of 14 different metrics all agreed that we had reached 99% accuracy (no matter how you measured it) with just 5% of the data.
Across several different modes of operation, and facing several different types of faults, the machine learning algorithms were (almost) always able to detect when something went wrong. Perhaps a little excess noise in a certain part of the signal, or a slightly earlier onset; or perhaps it was something more complex, like the fact that a spike in one of the 64 different sensor feeds was not immediately followed by a spike in another one, as it is usually does. Our feature engine could detect all of these different signatures — and a lot more, indeed, tens of thousands of them.
In truth, we were relieved to see our metrics rise up to 99% without any fine-tuning. A research paper might impress with accuracy even in the low 90s , but we knew full well that probability is a tough lover. If you are monitoring a single device over a period of a few days (as was the case in the historical dataset we were given), then 99% accuracy is more than sufficient. If, however, you monitor thousands of devices over months, or years, you had better start off with 99% accuracy, otherwise alert fatigue will kick in soon.
Our results confirmed not so much that the problem was “solved”, but rather that it is “solvable” with our choice of technology: a combination of sophisticated machine learning algorithms, with built-in failsafes to handle temporal variation, and a lean edge-cloud architecture.
The Future of Industrial IoT
The technical success of this initial proof of concept can only hint at the powerful implications for the future of the manufacturing industry.
Change brings opportunity and danger. The opportunities are obvious for manufacturers : better customer support, differentiation from the competition, software revenues via SaaS applications attached to their devices, better understanding of usage patterns, more uptime. The dangers are also pretty obvious : brands that have built a reputation of solid quality over generations will be competing with more agile manufacturers that can possibly be more aggressive in their cost plus pricing via creating intelligent revenue from software services.
We feel there is a seismic shift which will happen in the manufacturing sector in the next few years. The cards will be dealt again and the game will have new rules.


